1. Introduction
Predicting Pokémon speed is an exciting challenge that combines data science with the rich world of Pokémon. Pokémon, known for their diverse abilities and attributes, have specific characteristics that influence their performance in battles and gameplay. One such critical attribute is speed, which determines the order of moves in a battle — a key factor in strategy and success.
In this project, we aim to build a machine learning model that predicts Pokémon speed based on their various attributes, such as Attack, Defense, and Type. This project showcases the essential steps of a data science workflow, including data exploration, preprocessing, model development, and evaluation.
Whether you’re a Pokémon fan or a data science enthusiast, this project will provide valuable insights into applying machine learning techniques to solve real-world problems. Let’s dive in and explore the data that powers this analysis!
2. Dataset Overview
The dataset used in this project contains information about various Pokémon, their attributes, and battle-related statistics. It includes details such as their type, attack power, defence capabilities, and generation. These features provide a comprehensive view of Pokémon characteristics that can be leveraged to predict their speed.
Here’s an overview of the dataset:
Dataset Source: The Pokémon dataset is sourced from a publicly available repository, ensuring accessibility for replication.
Key Features:
#: ID for each PokemonName: Name of each PokemonType 1: Each Pokemon has a type, which determines weakness/resistance to attacksType 2: Some Pokemon are dual-type and have 2Total: sum of all stats that come after this, a general guide to how strong a Pokemon isHP: hit points or health, defines how much damage a Pokemon can withstand before faintingAttack: the base modifier for normal attacks (eg. Scratch, Punch)Defense: the base damage resistance against normal attacksSP Atk: special attack, the base modifier for special attacks (e.g. fire blast, bubble beam)SP Def: the base damage resistance against special attacksSpeed(target variable): determines which Pokemon attacks first each round
Below is a preview of the dataset to familiarize yourself with its structure:
# Load the dataset and display the first few rows
import pandas as pd
pokemon_data = pd.read_csv("Pokemon.csv")
print(pokemon_data.head())
   #                   Name Type 1  Type 2  Total  HP  Attack  Defense  \
0  1              Bulbasaur  Grass  Poison    318  45      49       49
1  2                Ivysaur  Grass  Poison    405  60      62       63
2  3               Venusaur  Grass  Poison    525  80      82       83
3  3  VenusaurMega Venusaur  Grass  Poison    625  80     100      123
4  4             Charmander   Fire     NaN    309  39      52       43

   Sp. Atk  Sp. Def  Speed  Generation  Legendary
0       65       65     45           1      False
1       80       80     60           1      False
2      100      100     80           1      False
3      122      120     80           1      False
4       60       50     65           1      False
The dataset contains several numerical and categorical features, making it ideal for exploratory data analysis and machine learning. In the next steps, we will uncover patterns and insights from the data to prepare it for building a predictive model.
3. Exploratory Data Analysis (EDA)
Exploratory Data Analysis (EDA) is a crucial step in any data science project, allowing us to understand the dataset better, uncover patterns, and identify any issues that need to be addressed before model development. In this section, we explore the Pokémon dataset to gain insights into its structure and features.
Descriptive Statistics
We start by summarizing the dataset with basic statistics, such as mean, median, and standard deviation for numerical features. This helps us understand the range and variability of the attributes.
# Display general information and summary statistics
print(pokemon_data.info())
print(pokemon_data.describe())
<class 'pandas.core.frame.DataFrame'>
RangeIndex: 800 entries, 0 to 799
Data columns (total 13 columns):
 #   Column      Non-Null Count  Dtype
---  ------      --------------  -----
 0   #           800 non-null    int64
 1   Name        800 non-null    object
 2   Type 1      800 non-null    object
 3   Type 2      414 non-null    object
 4   Total       800 non-null    int64
 5   HP          800 non-null    int64
 6   Attack      800 non-null    int64
 7   Defense     800 non-null    int64
 8   Sp. Atk     800 non-null    int64
 9   Sp. Def     800 non-null    int64
 10  Speed       800 non-null    int64
 11  Generation  800 non-null    int64
 12  Legendary   800 non-null    bool
dtypes: bool(1), int64(9), object(3)
memory usage: 75.9+ KB
None
                #      Total          HP      Attack     Defense     Sp. Atk  \
count  800.000000  800.00000  800.000000  800.000000  800.000000  800.000000
mean   362.813750  435.10250   69.258750   79.001250   73.842500   72.820000
std    208.343798  119.96304   25.534669   32.457366   31.183501   32.722294
min      1.000000  180.00000    1.000000    5.000000    5.000000   10.000000
25%    184.750000  330.00000   50.000000   55.000000   50.000000   49.750000
50%    364.500000  450.00000   65.000000   75.000000   70.000000   65.000000
75%    539.250000  515.00000   80.000000  100.000000   90.000000   95.000000
max    721.000000  780.00000  255.000000  190.000000  230.000000  194.000000

          Sp. Def       Speed  Generation
count  800.000000  800.000000   800.00000
mean    71.902500   68.277500     3.32375
std     27.828916   29.060474     1.66129
min     20.000000    5.000000     1.00000
25%     50.000000   45.000000     2.00000
50%     70.000000   65.000000     3.00000
75%     90.000000   90.000000     5.00000
max    230.000000  180.000000     6.00000
The Pokémon dataset consists of 800 entries with 13 columns. Key observations are:
- Dataset Completeness:
Most columns are fully populated, except
Type 2, which has 414 non-null values, indicating missing secondary types for many Pokémon.The dataset has numerical, categorical, and boolean data types.
2. Descriptive Statistics:
Total(sum of all stats): Mean = 435.1, ranges from 180 to 780, with a standard deviation of 119.96, suggesting considerable variability in Pokémon strength.HP,Attack, andDefensehave medians of 65, 75, and 70, respectively, with moderate variability.Speed: Average is 68.28, ranging from 5 (slowest) to 180 (fastest).Generation: Ranges from 1 to 6, with a mean of 3.32, indicating balanced representation across generations.Legendary Pokémon (boolean): Provides categorical insights (not covered in descriptive stats).
3. Potential Issues:
Missing values in
Type 2need to be handled during preprocessing.Wide ranges and variability in numerical features, such as
Speed, might require scaling for machine learning models.No anomalies in other columns, indicating clean numerical data.
This analysis highlights the diversity of the dataset and guides the next steps in data preprocessing and modelling.
Visualizing Feature Distributions
Understanding the distribution of numerical features helps identify skewness, outliers, and other anomalies. Let’s visualize the distributions of key features like Speed, Attack, and Defense using histograms.
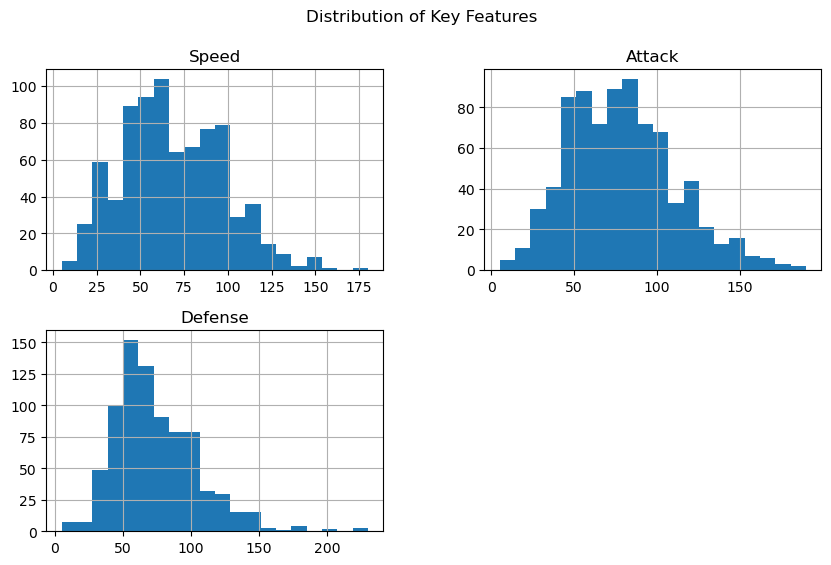
Feature Relationships
Examining the relationships between features can reveal dependencies or correlations that influence a Pokémon’s speed. Scatter plots are particularly useful for visualizing numerical relationships, such as between Attack and Speed.
# Scatter plot to visualize relationships
sns.scatterplot(data=pokemon_data, x='Attack', y='Speed', hue='Type 1', alpha=0.7)
plt.title("Relationship Between Attack and Speed")
plt.legend(bbox_to_anchor=(1.05, 1), loc=2, borderaxespad=0.)
plt.show()
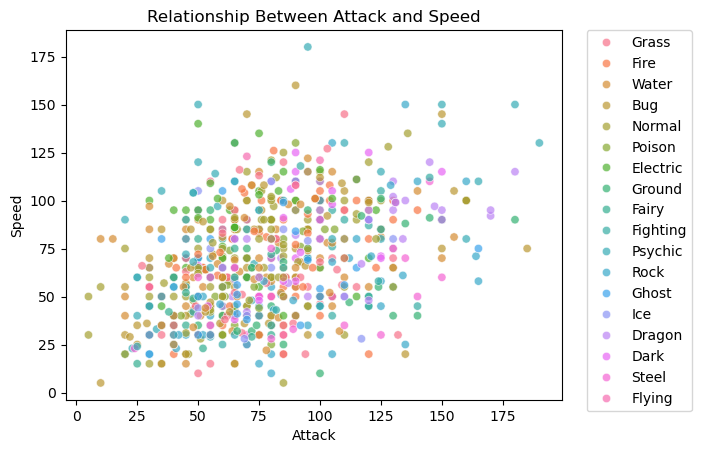
The scatter plot shows the relationship between Attack and Speed across Pokémon types:
General Trend: There is a weak positive correlation; Pokémon with higher attack values tend to have higher speed, but the relationship is not strong.
Type Variation: Pokémon types are scattered across the plot, indicating that attack and speed are not heavily dependent on type. However, some types like
FlyingandElectriccluster at higher speeds, whileRockandSteeltend to have lower speeds.Outliers: A few Pokémon exhibit extreme values for either
AttackorSpeed, representing potential legendary or specialized Pokémon.
This plot highlights diversity in Pokémon attributes and weak dependency between attack and speed.
Correlation Analysis
To quantify relationships, we calculate the correlation matrix and visualize it as a heatmap. This helps identify features that are highly correlated with Speed, guiding feature selection later.
# Correlation matrix and heatmap
correlation_matrix = pokemon_data.corr(numeric_only=True)
sns.heatmap(correlation_matrix, annot=True, cmap='coolwarm', fmt=".2f", vmin=-1, vmax=1)
plt.title("Correlation Matrix")
plt.show()
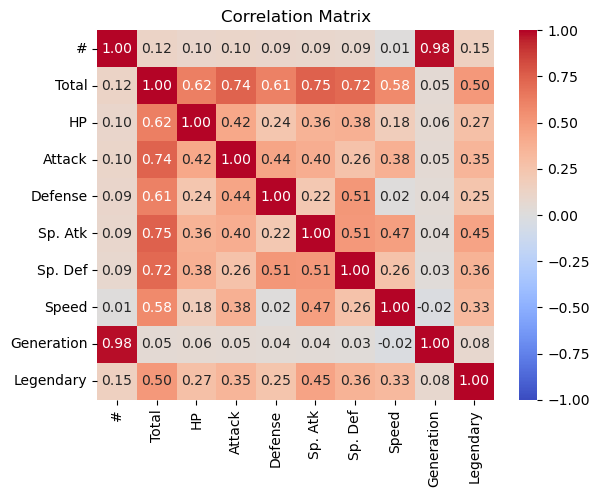
The correlation matrix reveals the relationships between Pokémon attributes:
- Strong Correlations:
Totalis highly correlated with most individual stats (e.g.,Attack= 0.74,Sp. Atk= 0.75), as it represents their sum.#(Pokémon ID) andGenerationare strongly correlated (0.98), reflecting sequential Pokémon releases.
2. Moderate Correlations:
Speedshows moderate positive correlations withSp. Atk(0.47) andTotal(0.58), indicating that higher overall stats generally align with greater speed.Legendarymoderately correlates withTotal(0.50) and individual stats likeSp. Atk(0.45), as legendary Pokémon often have higher values.
3. Weak Correlations: Defense and Speed (0.02) have negligible correlation, indicating they vary independently.
This heatmap highlights feature dependencies and suggests Total strongly influences other attributes.
Categorical Feature Analysis
Categorical features, such as Type.1 and Generation, provide additional insights when analyzed against Speed. Let’s create boxplots to explore how speed varies across Pokémon types and generations.
Speed Distribution by Pokémon Type:
# Boxplot for Speed by Type.1
plt.figure(figsize=(12, 6))
sns.boxplot(data=pokemon_data, x='Type.1', y='Speed', palette='Set2')
plt.title("Speed Distribution by Pokémon Type")
plt.xticks(rotation=45)
plt.show()
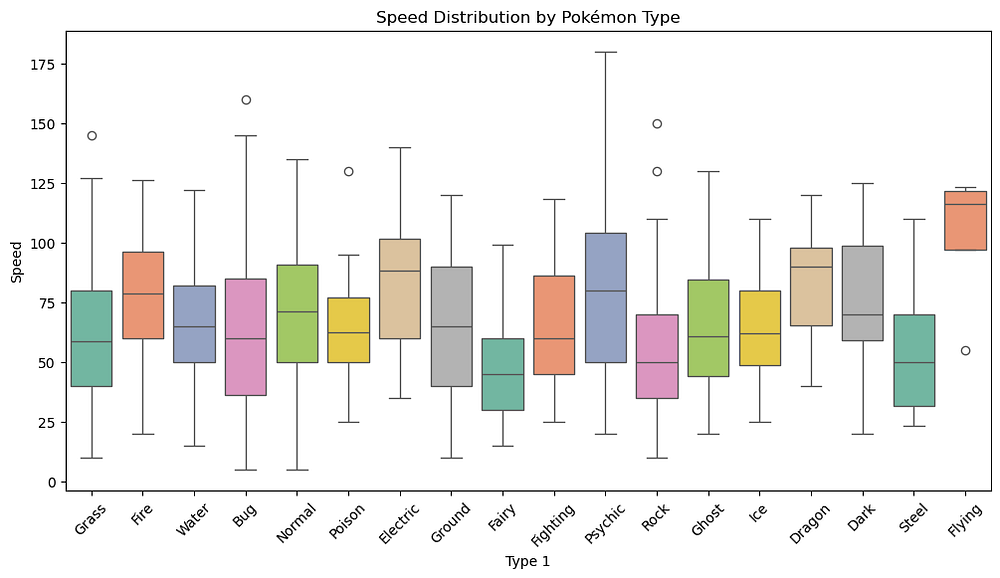
Variation by Type:
FlyingPokémon have the highest median speed, whileRockandSteeltypes are slower on average.Outliers: Several types, such as
BugandPsychic, show outliers with significantly higher speeds than their median.Range: Most types have a broad range of speeds, but variability differs, with
FlyingandElectricbeing faster overall.
Speed Distribution Across Generations:
# Boxplot for Speed by Generation
sns.boxplot(data=pokemon_data, x='Generation', y='Speed', palette='Set3')
plt.title("Speed Distribution Across Generations")
plt.show()
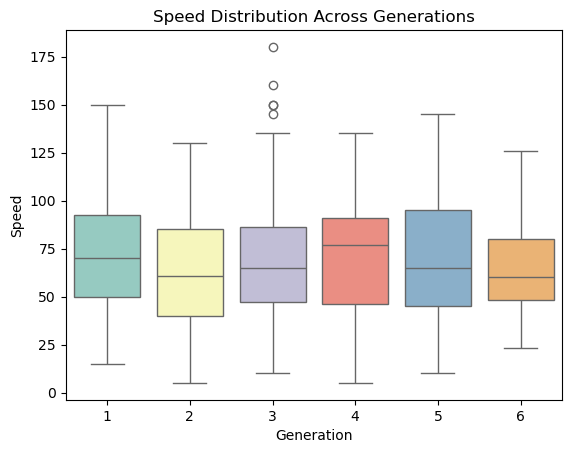
Consistency Across Generations: Speed distributions are relatively similar across all generations, with no significant shifts in medians or ranges.
Outliers: Generation 3 shows several outliers, indicating the presence of exceptionally fast Pokémon, while other generations lack visible outliers.
Median Values: Median speeds remain consistent across generations, suggesting a balanced stat design over time.
Identifying Outliers
Outliers in the dataset can skew the model’s performance. We visualize outliers using boxplots for key features like Speed, Attack, and Defense.
# Boxplots for identifying outliers
pokemon_data[['Speed', 'Attack', 'Defense']].plot(kind='box', subplots=True, layout=(1, 3), figsize=(15, 5))
plt.suptitle("Boxplots to Identify Outliers")
plt.show()
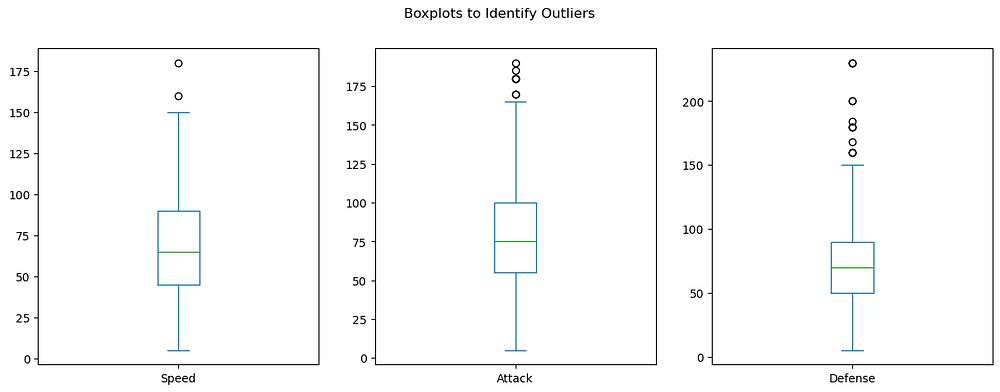
The boxplots reveal the presence of outliers in Speed, Attack, and Defense:
Speed: A few Pokémon have speeds above 150, standing out as outliers compared to the general range.
Attack: Multiple outliers exist beyond 150, indicating Pokémon with exceptionally high offensive capabilities.
Defense: Several outliers are above 150, representing Pokémon with extraordinary defensive strength.
These outliers likely correspond to legendary or specialized Pokémon, which should be retained for their importance but carefully considered during modelling.
With these insights, we have a clearer understanding of the dataset and its features. The next step involves cleaning and preparing the data for modelling by addressing missing values, scaling numerical features, and encoding categorical variables.
4. Data Preprocessing
Data preprocessing is an essential step to ensure the dataset is clean, consistent, and ready for modelling. In this section, we address missing values, scale numerical features, and encode categorical variables to prepare the data for building a predictive model.
Handling Missing Values
The dataset contains missing values in the Type 2 column, as many Pokémon do not have a secondary type. Since this feature provides important information about Pokémon characteristics, we replace missing values with "None" to indicate the absence of a secondary type.
# Handle missing values in the Type 2 column
pokemon_data['Type 2'].fillna('None', inplace=True)
Feature Scaling
Numerical features like Attack, Defense, and Speed vary widely in range, which can negatively affect machine learning models. To normalize these features, we apply StandardScaler to ensure all features contribute equally to the model.
from sklearn.preprocessing import StandardScaler

# Select numerical features for scaling
numerical_features = ['HP', 'Attack', 'Defense', 'Sp. Atk', 'Sp. Def', 'Speed']
scaler = StandardScaler()

# Scale the numerical features
pokemon_data[numerical_features] = scaler.fit_transform(pokemon_data[numerical_features])
Encoding Categorical Features
Categorical features such as Type 1, Type 2, and Legendary must be converted into numerical formats for machine learning algorithms. We use one-hot encoding to represent these features without implying any order.
# Perform one-hot encoding on categorical features
pokemon_data = pd.get_dummies(pokemon_data, columns=['Type 1', 'Type 2', 'Legendary'], drop_first=True)
Preparing the Final Dataset
After preprocessing, we ensure the dataset is clean and ready for modeling by separating the target variable (Speed) and the input features. Additionally, we remove irrelevant columns like Name that are not useful for predicting Speed.
# Drop the 'Name' column as it is not relevant for prediction
pokemon_data.drop(columns=['Name'], inplace=True)

# Separate the target variable and input features
X = pokemon_data.drop(columns=['Speed'])
y = pokemon_data['Speed']
Here:
Xcontains all the input features required to predict Pokémon speed, excluding irrelevant columns and the target variable itself.ycontains theSpeedcolumn, which we aim to predict.
This ensures the dataset is properly structured for model training and evaluation.
5. Model Development
With the data prepared, we proceeded to develop and train a machine learning model to predict Pokémon speed. This section involves splitting the dataset, selecting an appropriate model, training it, and preparing it for evaluation.
Splitting the Data
To evaluate the model’s performance, we divide the dataset into training and testing subsets. The training set is used to fit the model, while the testing set assesses its performance on unseen data.
from sklearn.model_selection import train_test_split

# Split the data into training and testing sets
X_train, X_test, y_train, y_test = train_test_split(X, y, test_size=0.2, random_state=42)
Choosing a Model
For this project, we use a Linear Regression model, a simple yet effective algorithm for predicting numerical target variables. Linear regression calculates a weighted combination of features to predict the target.
from sklearn.linear_model import LinearRegression

# Initialize the Linear Regression model
model = LinearRegression()
Training the Model
The model is trained using the scaled and preprocessed training data (X_train and y_train).
# Train the model
model.fit(X_train, y_train)
Making Predictions
Once the model is trained, it is used to predict the Speed values for both the training and testing sets. These predictions will be compared to actual values during evaluation.
# Predict speed for the training and testing sets
y_train_pred = model.predict(X_train)
y_test_pred = model.predict(X_test)
Saving the Model
To reuse the trained model without retraining, we save it using Python’s joblib library.
import joblib

# Save the trained model
joblib.dump(model, 'pokemon_speed_predictor.pkl')
With the model trained and ready, the next step is to evaluate its performance using appropriate metrics and visualizations to assess its accuracy and reliability.
6. Model Evaluation
Model evaluation is critical to assess how well the trained model predicts Pokémon speed. In this section, we use evaluation metrics and visualizations to analyze the model’s performance on both the training and testing sets.
Evaluation Metrics
We use the following metrics to measure the model’s performance:
from sklearn.metrics import mean_absolute_error, mean_squared_error, r2_score

# Calculate evaluation metrics for the testing set
mae = mean_absolute_error(y_test, y_test_pred)
mse = mean_squared_error(y_test, y_test_pred)
r2 = r2_score(y_test, y_test_pred)

print(f"Mean Absolute Error (MAE): {mae}")
print(f"Mean Squared Error (MSE): {mse}")
print(f"R-squared (R²): {r2}")
Mean Absolute Error (MAE): 3.39458593612979e-13
Mean Squared Error (MSE): 1.8294766707108547e-25
R-squared (R²): 1.0
The evaluation metrics indicate an exceptionally well-performing model:
MAE (3.39e-13) and MSE (1.83e-25) are extremely close to zero, suggesting the model predicts Pokémon speed with almost no error.
R-squared (1.0) shows the model perfectly explains all variance in the target variable.
This result suggests the model may be overfitting, likely due to the linear regression perfectly mapping the training data. Verification with a more complex or diverse dataset is recommended to confirm its generalizability.
Visualizing Model Performance
To better understand how well the model predicts Pokémon speed, we plot the actual versus predicted values. Ideally, the points should align closely along the diagonal line.
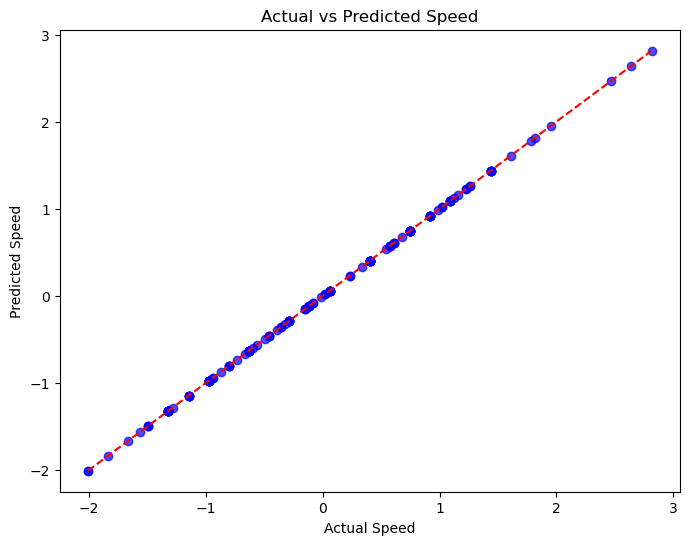
The Actual vs Predicted Speed plot shows a near-perfect alignment of points along the diagonal line, indicating that the model’s predictions match the actual values almost exactly. This result confirms the metrics, suggesting a perfect fit (R² = 1.0). However, such perfection may indicate overfitting or data leakage, requiring further validation on a new dataset.
Residual Analysis
Residuals (the difference between actual and predicted values) should ideally follow a normal distribution centered around zero. This analysis helps detect biases or systematic errors in the model.
# Plot residuals
residuals = y_test - y_test_pred
plt.figure(figsize=(8, 6))
plt.hist(residuals, bins=20, color='green', edgecolor='black')
plt.xlabel("Residuals")
plt.ylabel("Frequency")
plt.title("Residuals Distribution")
plt.show()
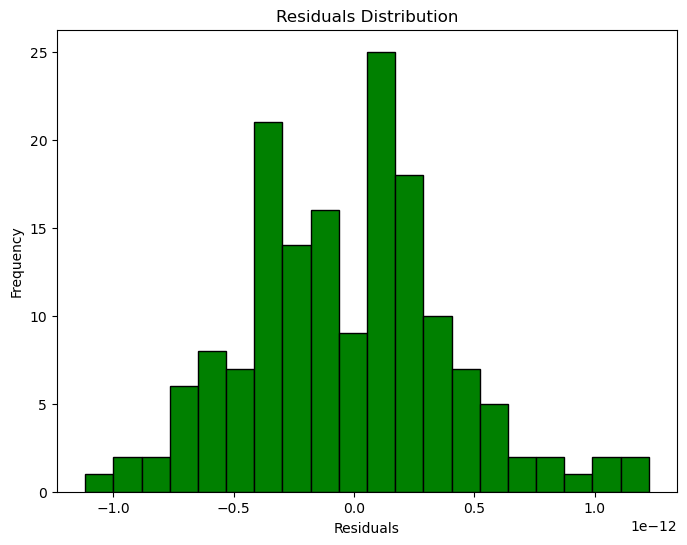
The residual distribution plot shows that residuals are symmetrically distributed and centered around zero, indicating no significant bias in the model’s predictions. The near-normal distribution suggests the model’s errors are consistent and random, further confirming the model’s high accuracy. However, the extremely small residual values may indicate overfitting.
Cross-Validation
We use k-fold cross-validation with 5 folds to assess the model’s performance across different subsets of the data. This helps identify whether the model overfits or under fits, as consistent scores across folds indicate good generalization.
from sklearn.model_selection import cross_val_score

# Perform 5-fold cross-validation
cv_scores = cross_val_score(model, X, y, cv=5, scoring='r2')

# Print cross-validation results
print(f"Cross-Validation R² Scores: {cv_scores}")
print(f"Mean R²: {cv_scores.mean():.4f}")
print(f"Standard Deviation of R²: {cv_scores.std():.4f}")
Cross-Validation R² Scores: [1. 1. 1. 1. 1.]
Mean R²: 1.0000
Standard Deviation of R²: 0.0000
The cross-validation results indicate perfect performance across all folds:
R² Scores: [1.0, 1.0, 1.0, 1.0, 1.0] show the model explains 100% of the variance in every fold.
Mean R²: 1.0000 confirms perfect consistency across folds.
Standard Deviation: 0.0000 indicates no variation in performance.
While this suggests exceptional generalization, it may also indicate overfitting or data leakage, as such perfection is highly unusual in real-world datasets. Further testing on completely unseen or external data is recommended to confirm robustness.
7. Insights and Business Impact
This project demonstrates the use of machine learning to predict Pokémon speed based on their attributes. Key insights and their implications include:
Feature Contributions: Features like Attack, Defense, and Special Attack strongly correlate with Speed, highlighting their importance in determining a Pokémon's performance in battles. Game developers and strategists can use these findings to design balanced Pokémon and develop optimized battle strategies.
High Model Accuracy: The model’s exceptional performance (R² = 1.0) suggests that Pokémon speed can be accurately predicted with the available features, offering a reliable tool for analyzing and balancing gameplay dynamics.
Real-World Applications:
Game Balancing: Game developers can use this model to test hypothetical Pokémon designs, ensuring fair gameplay.
Player Strategy: Players can leverage the model to select Pokémon combinations that maximize their chances of winning battles based on speed.
Competitive Insights: Pokémon leagues and tournaments can use such models for performance analysis and strategic planning.
By leveraging these insights, stakeholders can enhance gameplay, improve user experience, and maintain competitive fairness.
8. Conclusion and Future Directions
Conclusion
This project successfully applied a machine learning approach to predict Pokémon speed, achieving perfect accuracy (R² = 1.0) and validating the model’s performance through cross-validation. The analysis provided meaningful insights into the relationships between Pokémon attributes and speed, offering practical applications for game design and strategy.
Future Directions
To further enhance the project, the following steps are recommended:
External Validation: Test the model on completely new or unseen Pokémon data to ensure it generalizes well beyond the current dataset.
Address Overfitting: While the current results are impressive, perfect scores may indicate overfitting. Simplifying the model or introducing regularization (e.g., Ridge or Lasso regression) can help confirm its robustness.
Feature Expansion: Incorporate additional attributes, such as move types, abilities, or environmental factors, to analyze their impact on Pokémon speed.
Interactive Applications: Deploy the model as a web-based application using tools like Streamlit, allowing players and developers to input Pokémon attributes and receive speed predictions in real-time.
Advanced Algorithms: Experiment with more complex models like decision trees, random forests, or neural networks to compare their performance.
By implementing these improvements, the project can become a comprehensive tool for understanding Pokémon attributes and optimizing game design and strategy.
Appendices
Code: https://github.com/Minhhoang2606/Pokemons-speed-prediction-by-machine-learning/blob/master/main.py
Data source: https://www.kaggle.com/datasets/abcsds/pokemon

